
FROM REPORT TO PRIORITY
Start with the visitor’s slowest important experience. A score helps summarize a lab run, but the underlying metric and affected page explain what to investigate.
Total Dry: a recorded comparison
The supplied Total Dry PageSpeed Insights reports record the following before/after lab results. They are not a new live measurement or a statement about historical real-user field data.
| Device | Performance | Largest Contentful Paint | Total Blocking Time |
|---|---|---|---|
| Mobile | 55 → 97 | 11.5 s → 2.3 s | 220 ms → 60 ms |
| Desktop | 81 → 100 | 1.5 s → 0.7 s | 290 ms → 20 ms |
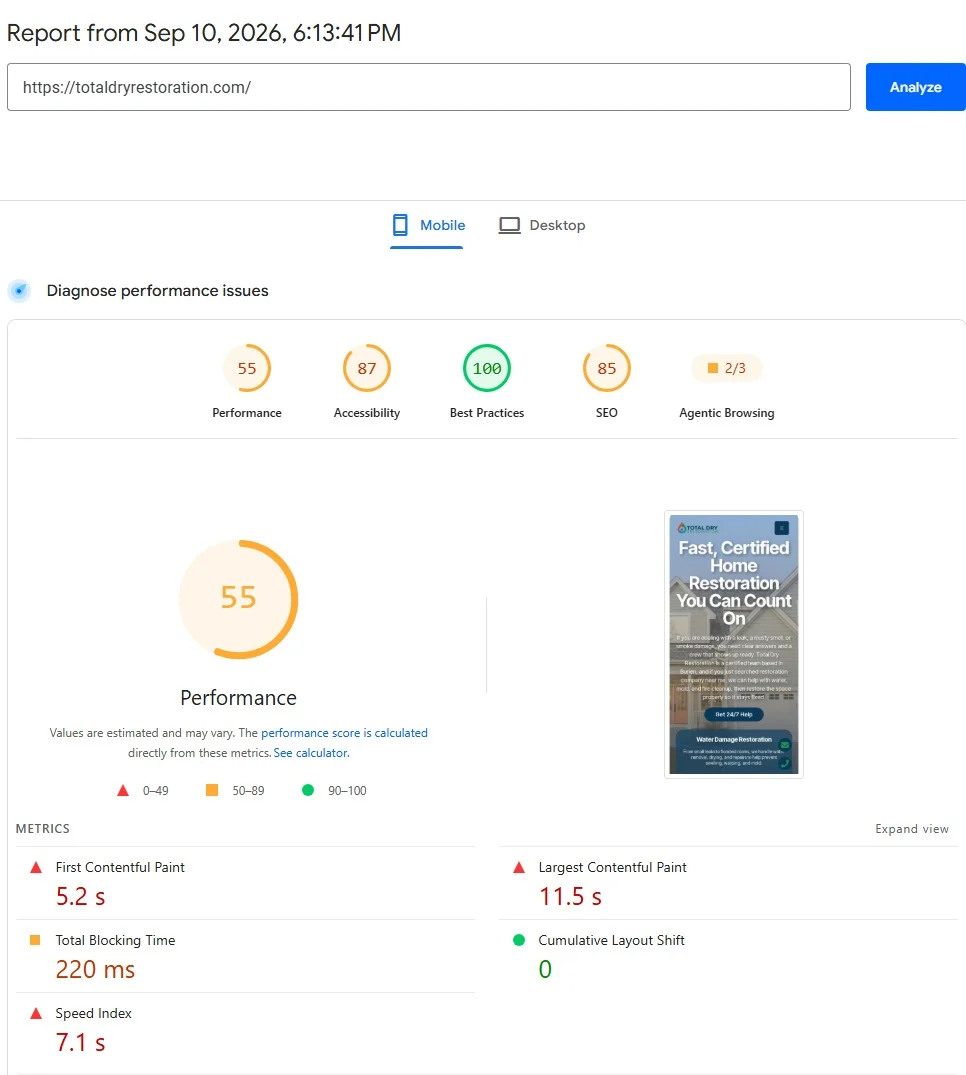
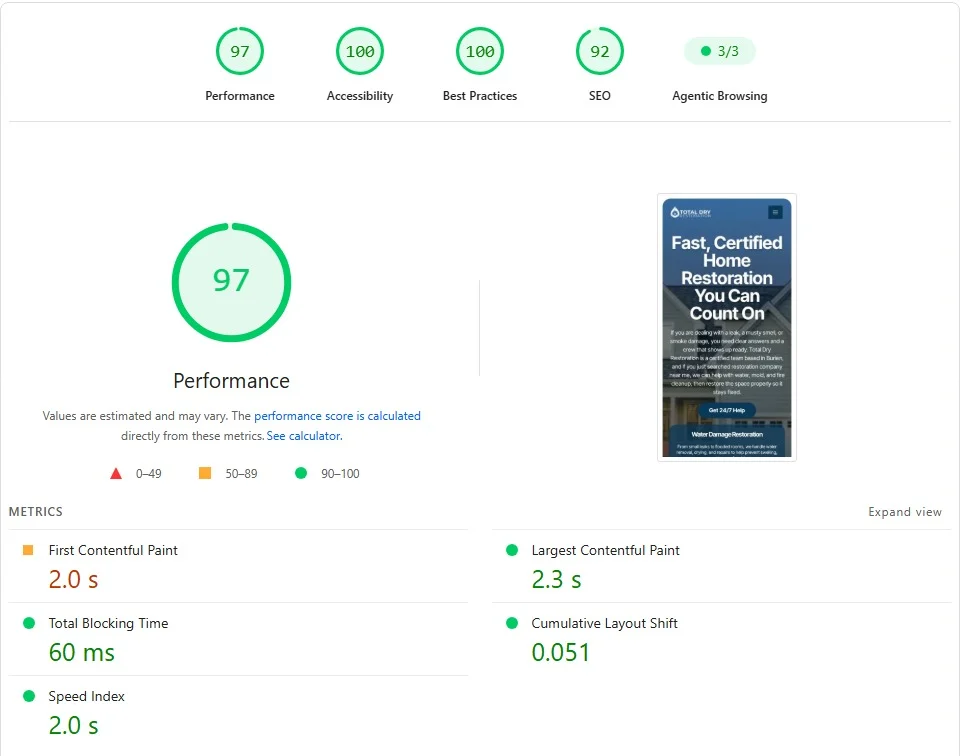
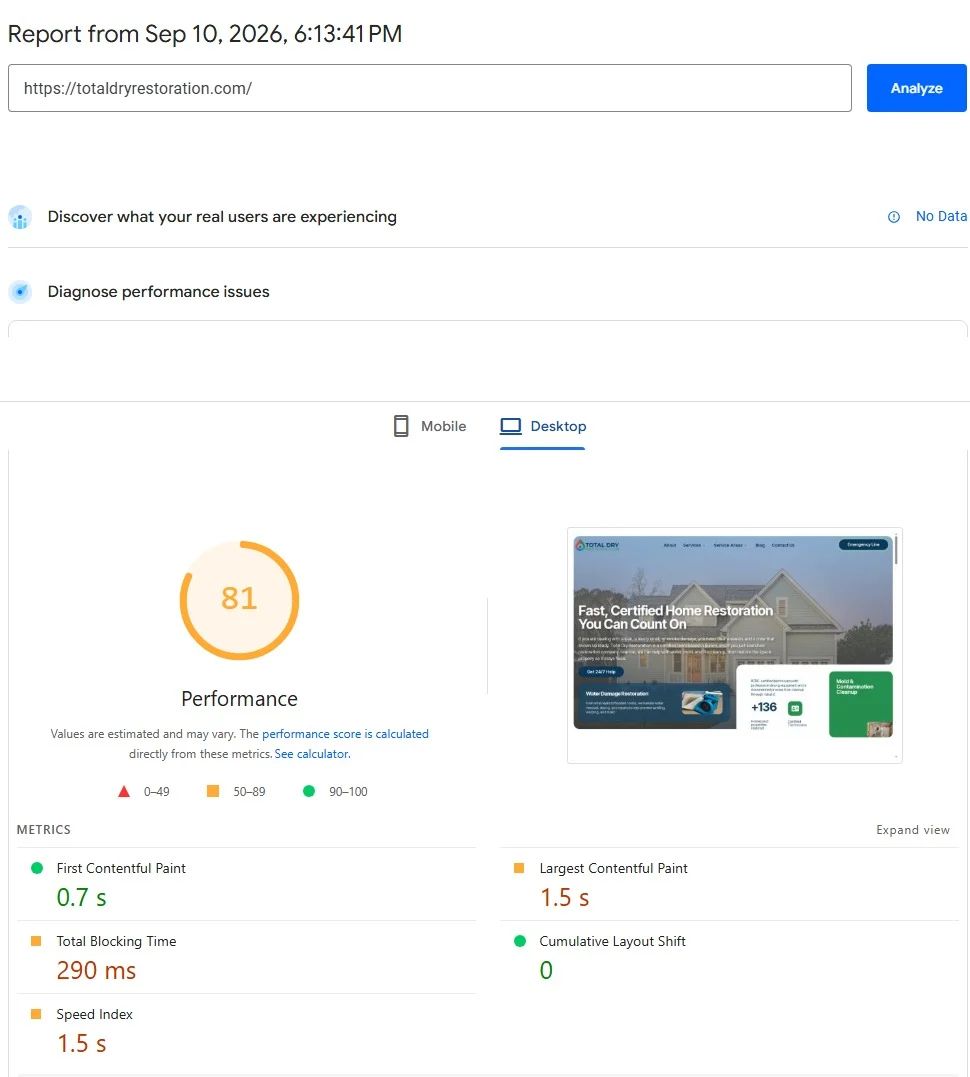
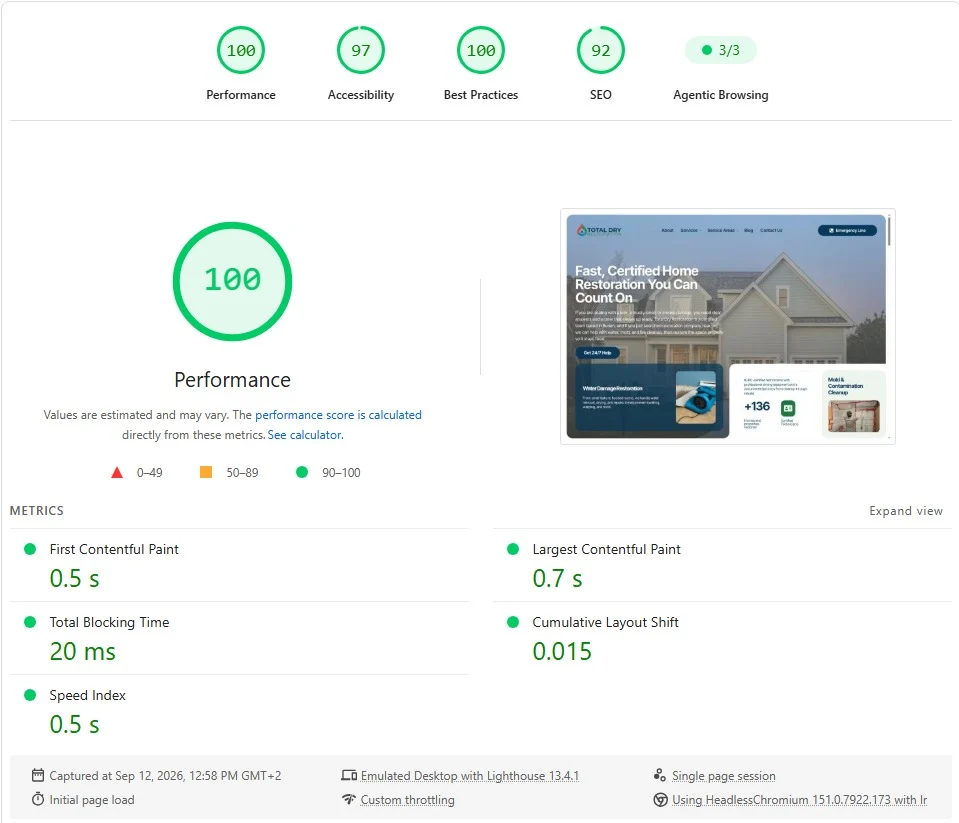
Mobile LCP was the clearest issue in the initial reports. That makes the loading path for the largest visible element a useful first investigation. The comparison does not isolate which change caused each improvement or guarantee similar results on another site.
Choose the next task
| Observation | Investigate first | Record before changing |
|---|---|---|
| Large visible content appears late | LCP element, response time, asset discovery, image size and rendering dependencies | Affected URL/device, report date, element and waterfall |
| Interaction stalls while the page loads | Long JavaScript tasks and unnecessary third-party work | TBT, task duration and scripts involved |
| Content jumps as assets arrive | Missing dimensions and late content/font insertion | Shifted element and triggering resource |
| Lab and field numbers disagree | Test conditions, device/network mix and field reporting period | Lab setup and field data coverage |
A practical order of work
- Capture the URL, device and report date. Separate the lab diagnostics from field data before interpreting a result.
- Identify one metric and the element or dependency behind it. Prioritize an important template or landing page with a reproducible issue.
- Make the smallest relevant change. For an image-related LCP issue, investigate discovery, dimensions and compression before changing unrelated code.
- Compare the same URL and device under comparable lab conditions. Keep the report and note material environment differences.
- Check whether the page remains usable. Track real-user trends over their reporting period rather than promising an immediate historical update.
Use a short decision record
Example: “Mobile hero appears late. Inspect the actual LCP image request and rendering path. Owner: developer. Evidence: supplied mobile report. Next action: identify the limiting dependency before selecting a fix.” This is a diagnostic example, not a claim about the exact Total Dry implementation.
Reference: Lab and field data differences.
Need help interpreting an interacting loading path? Explore our website development service.